
3 ways to add LLMs to your Python workflow
Plus code snippets to get you started 🐣


Data Science & Analytics jobs are changing fast. Whether we want it to or not 🤷🏻♀️
A lot of the manual work Data folks do today can be handled (partially) by AI. Writing the first draft of a SQL query, summarizing a dashboard into a one-pager, categorizing unstructured survey responses… these are all tasks an LLM can do quickly.
That means two things.
The scary part: if you don’t adapt, you risk being replaced by the analysts who do.
The exciting part: if you do adapt, you immediately move up the value chain. Instead of spending time on grunt work, you can spend time on interpretation, business impact, and strategy.
The companies hiring today want Analysts & Scientists who can leverage AI to move faster, drive more value, and save costs.
So in this article, I’m going to share:
How to come up with ideas to use AI in your Python analyses
How to define your MVP
3 examples on how to do this in Python
How to test and iterate on your workflow
How to come up with project ideas
This is probably the hardest part of using AI in your analytics workflow — figuring out where, how and why to use it.
I have a simple rule of thumb: look for tasks that are repetitive or time-consuming. These are usually good candidates for optimizing with AI.
For example (just a few to get your brain juices going):
Repetitive tasks: weekly KPI reports, ad hoc SQL queries you write over and over
Messy / unstructured inputs: survey responses, customer support tickets, open-ended feedback
Communication overhead: translating data into plain English for stakeholders, condensing dashboards into 3 bullet points.
If you’re not sure, just track your own work for a week. Every time you find yourself saying, “Ugh, this again 🤢” put that on your list of “Potential AI Projects”.
Important checkpoint: Is an AI solution necessary?
Now before you go on to the next step.. ask yourself: Is an AI solution necessary here? Or does it just add unnecessary complexity?
^This question is so important because as Data Scientists & Analysts, we’re hired to deliver value. So I always ask myself.. is this the simplest way I can generate value? If an easier solution (than the AI one) is available, do that!
How to define your MVP
MVP = Minimum Viable Product
One of the biggest mistakes people make when trying to use AI is going too big, too fast… especially, if this is your first AI project.
Ask yourself: What is the smallest possible way AI could add value here?
For example,
Instead of “AI writes my SQL” — the MVP = AI drafts a query for a single KPI.
Instead of “AI automates reporting” — the MVP = AI generates the first paragraph of the weekly KPI email.
Instead of “AI cleans my dataset” — MVP = AI classifies one messy column (like free-text survey responses).
The key is to start with something tiny, get it working, and then build from there.
Remember, your MVP is just your starting point. You might never even show this version to another human! This is to help you validate that your idea is viable!
3 practical examples — with code snippets
Ok, everything I’ve talked about so far might sound abstract, so let’s go over 3 concrete examples on how you might implement AI in your analytics workflows.
In these examples, I’m just going to use the OpenAI models & Python library — the one I’m most familiar with. But you can also integrate with Anthropic, Gemini, OpenRouter.. whatever your choice of model!
Example 1: Classify messy survey responses
We’re going to use an LLM to turn free-text into structured categories.
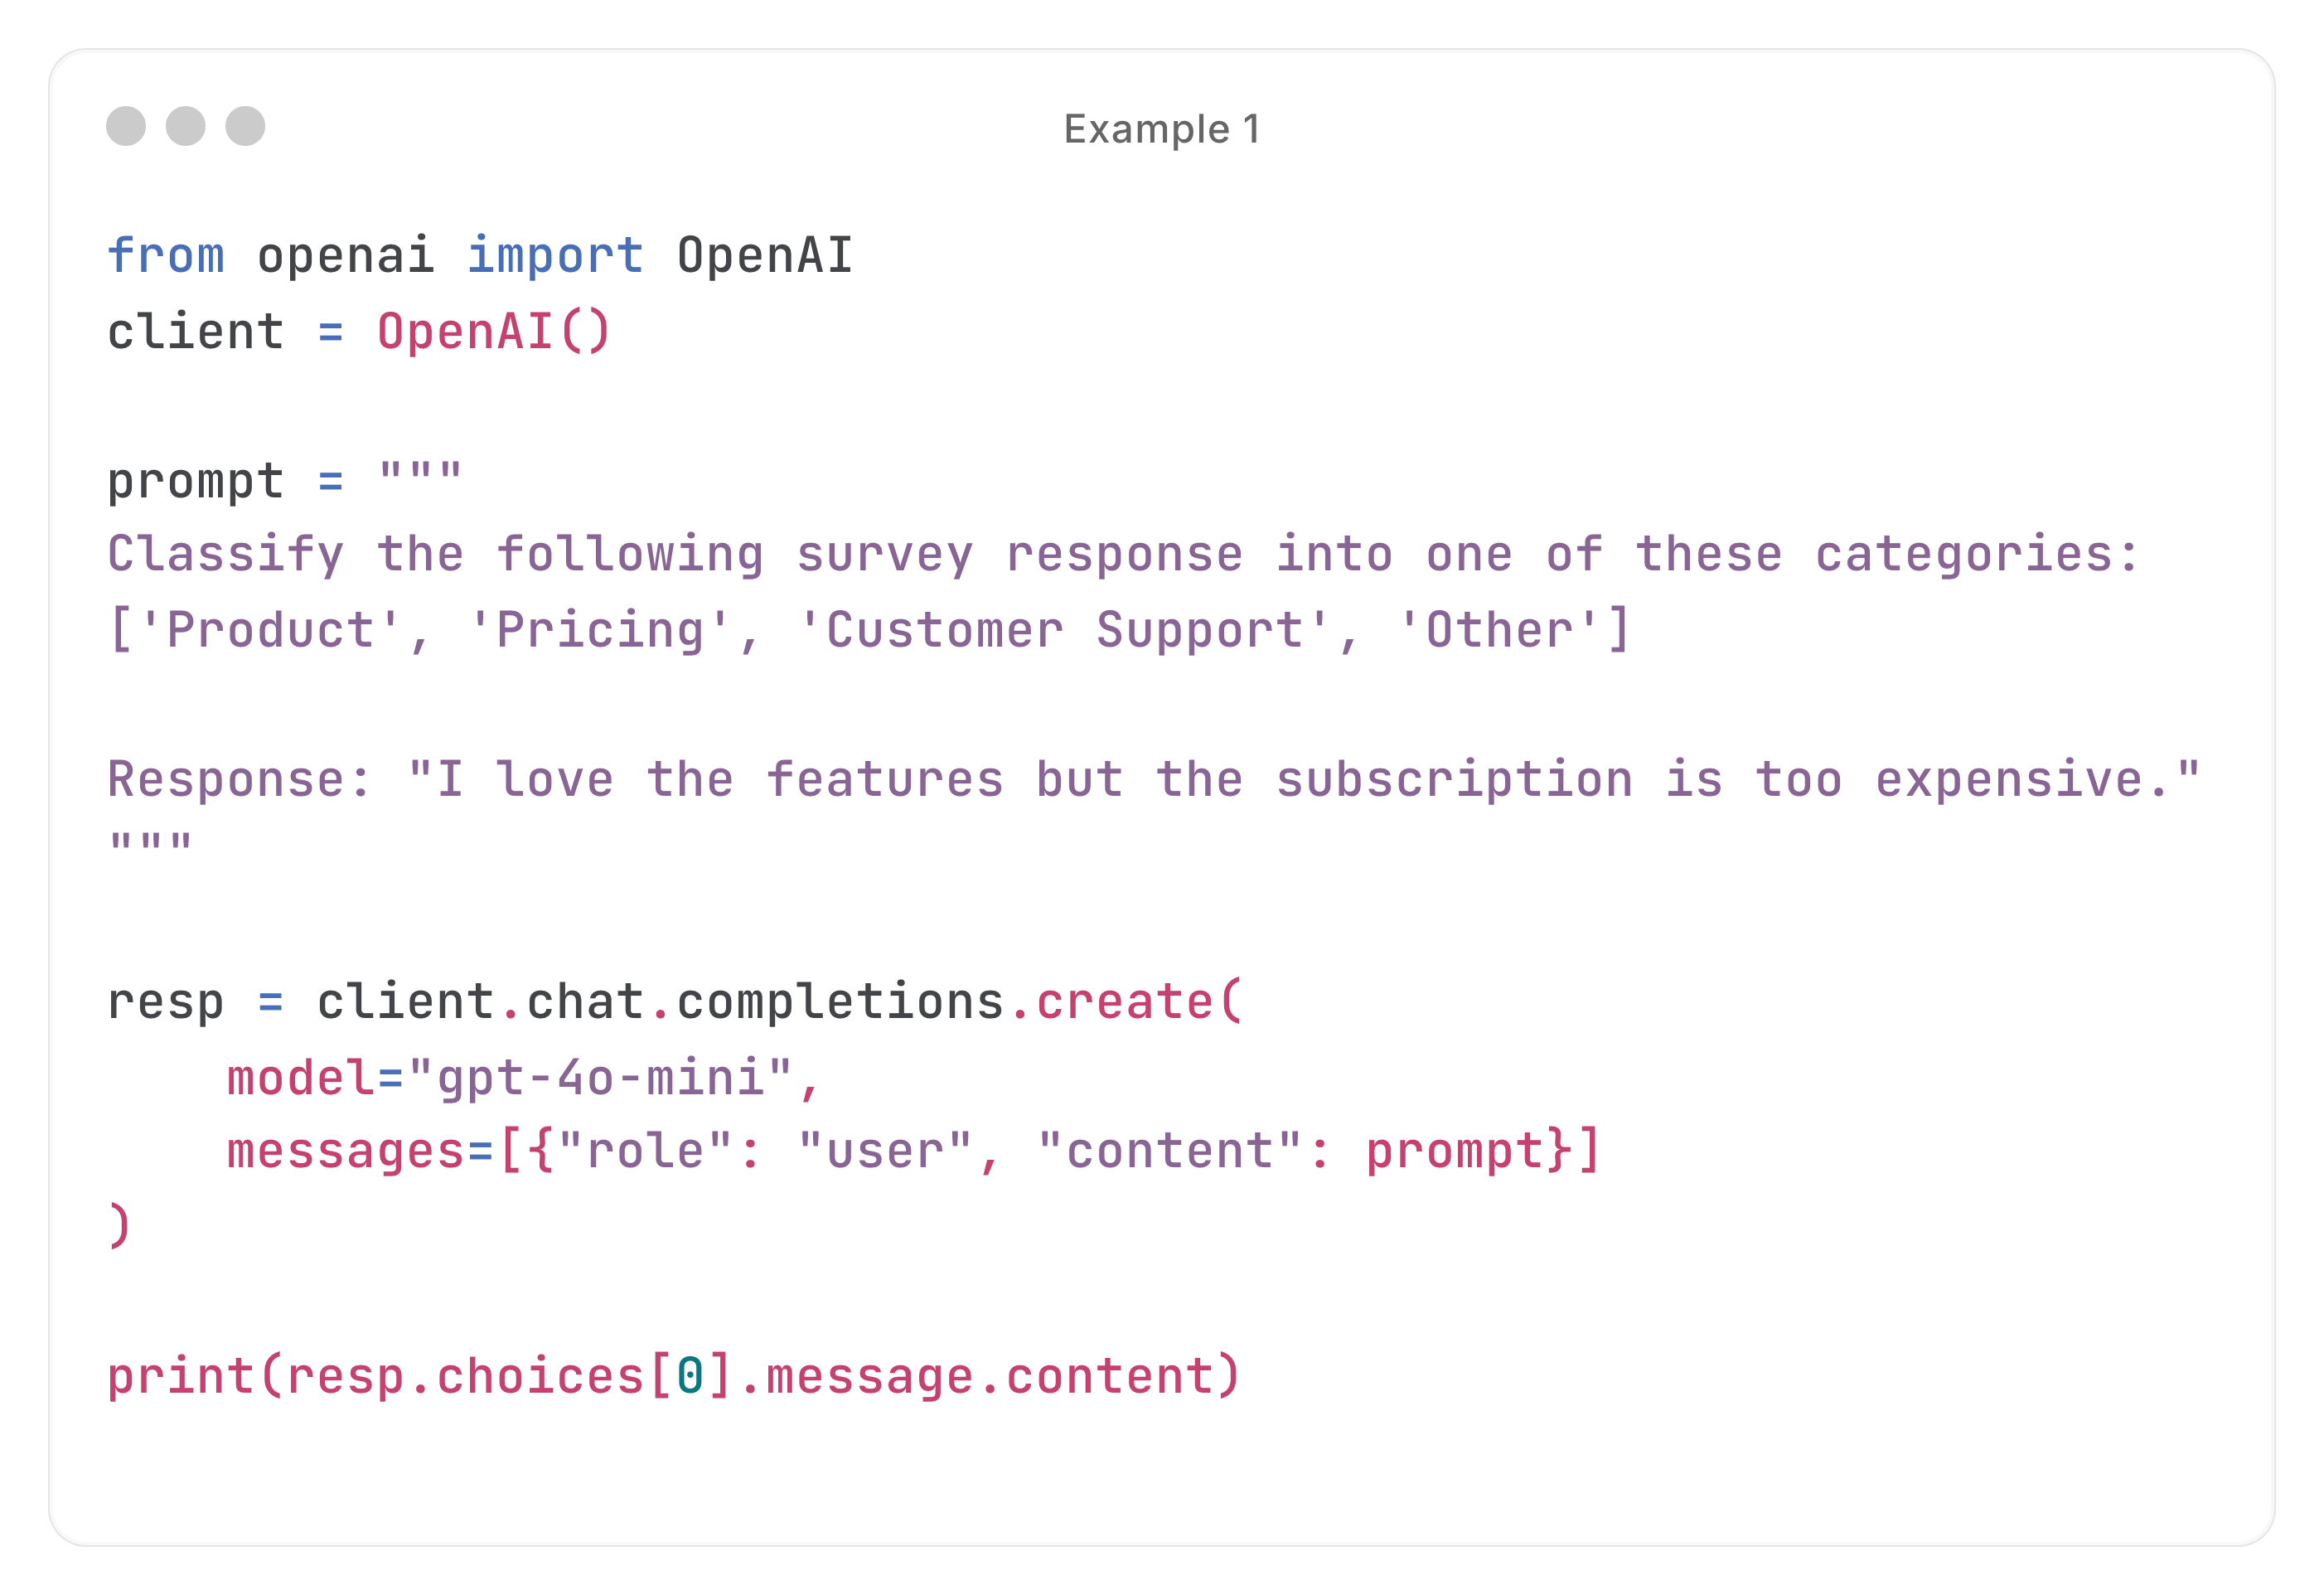
In the code, we are hard coding the Response in the prompt variable. But in the real world, we might iterate through a Dataframe of responses, and adding the classification into a new column in that Dataframe!
Example 2: Summarize a KPI table
We’re going to turn raw numbers into a summary, in English. This helps you save time when writing an exec update or a team Slack post — of course, please validate what the AI comes up with before sharing it!
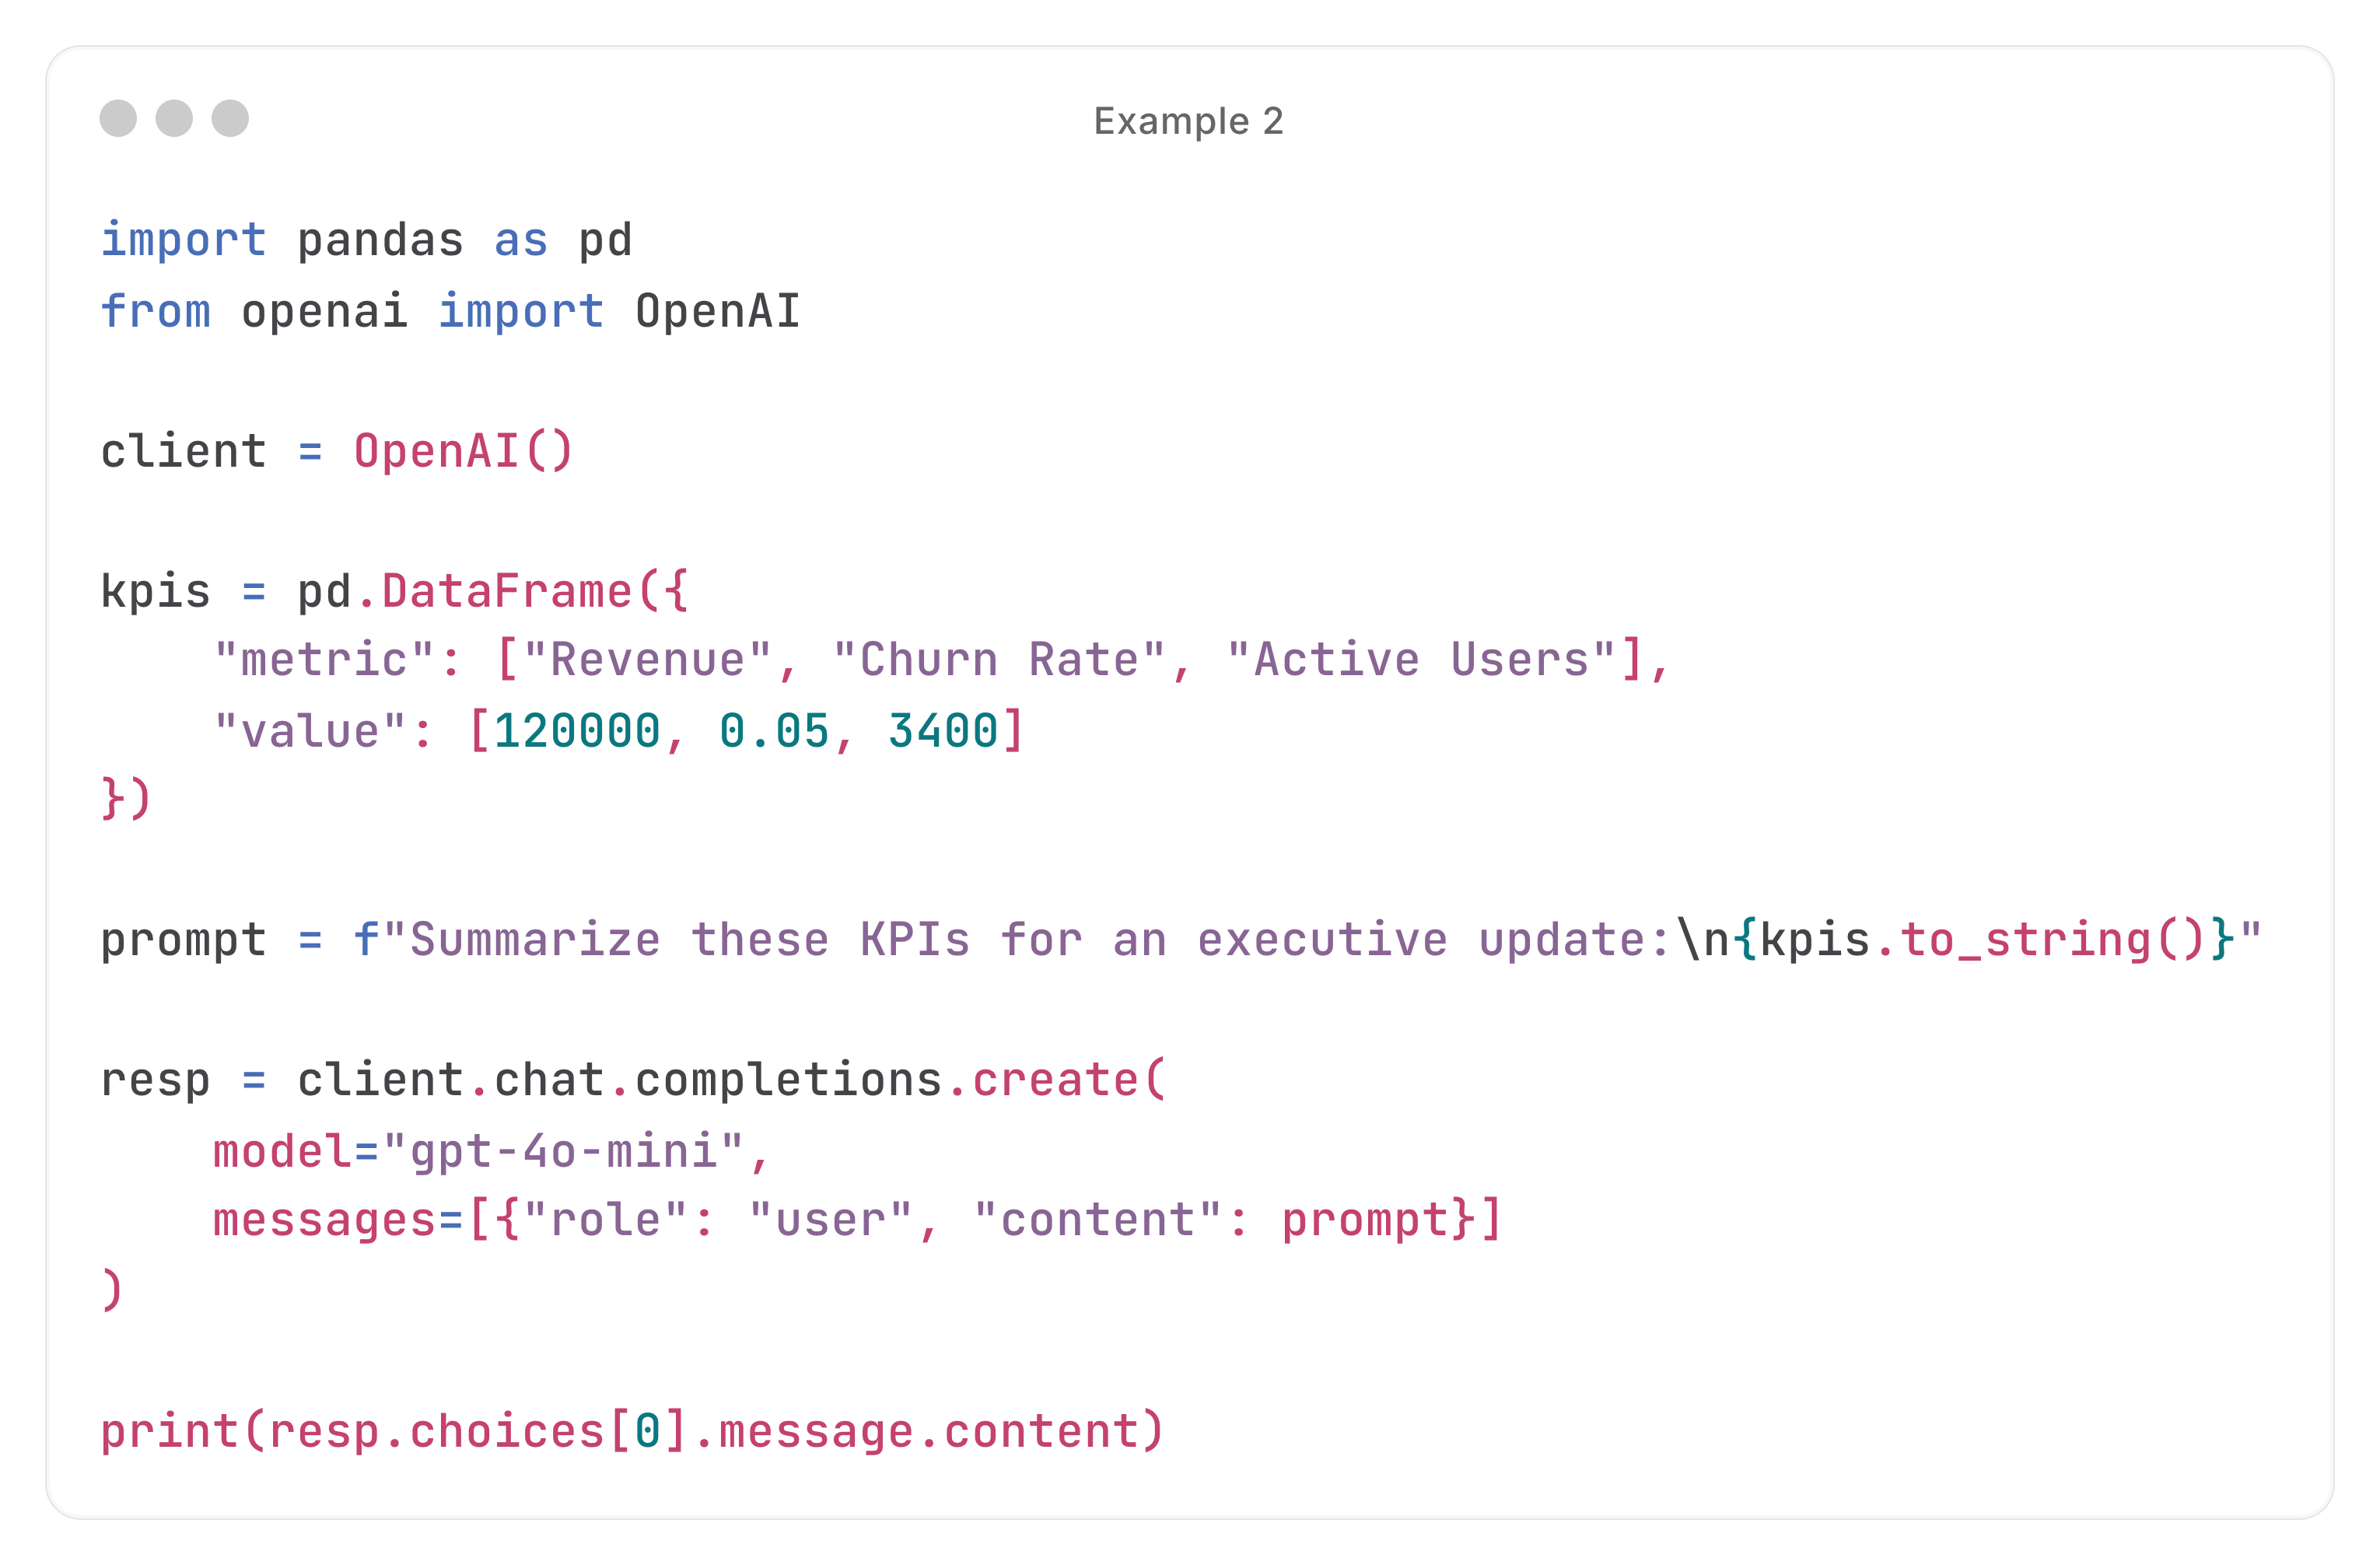
In this example, we’re just passing in a toy Dataframe with the data to summarize. But you could take this further:
Build a script that pulls real KPI data from your database automatically each week
Add chart or image input support so stakeholders can paste a screenshot of a dashboard instead of sending raw numbers
Example 3: Draft a SQL query
Here we’ll get AI to generate a first draft of a SQL query.
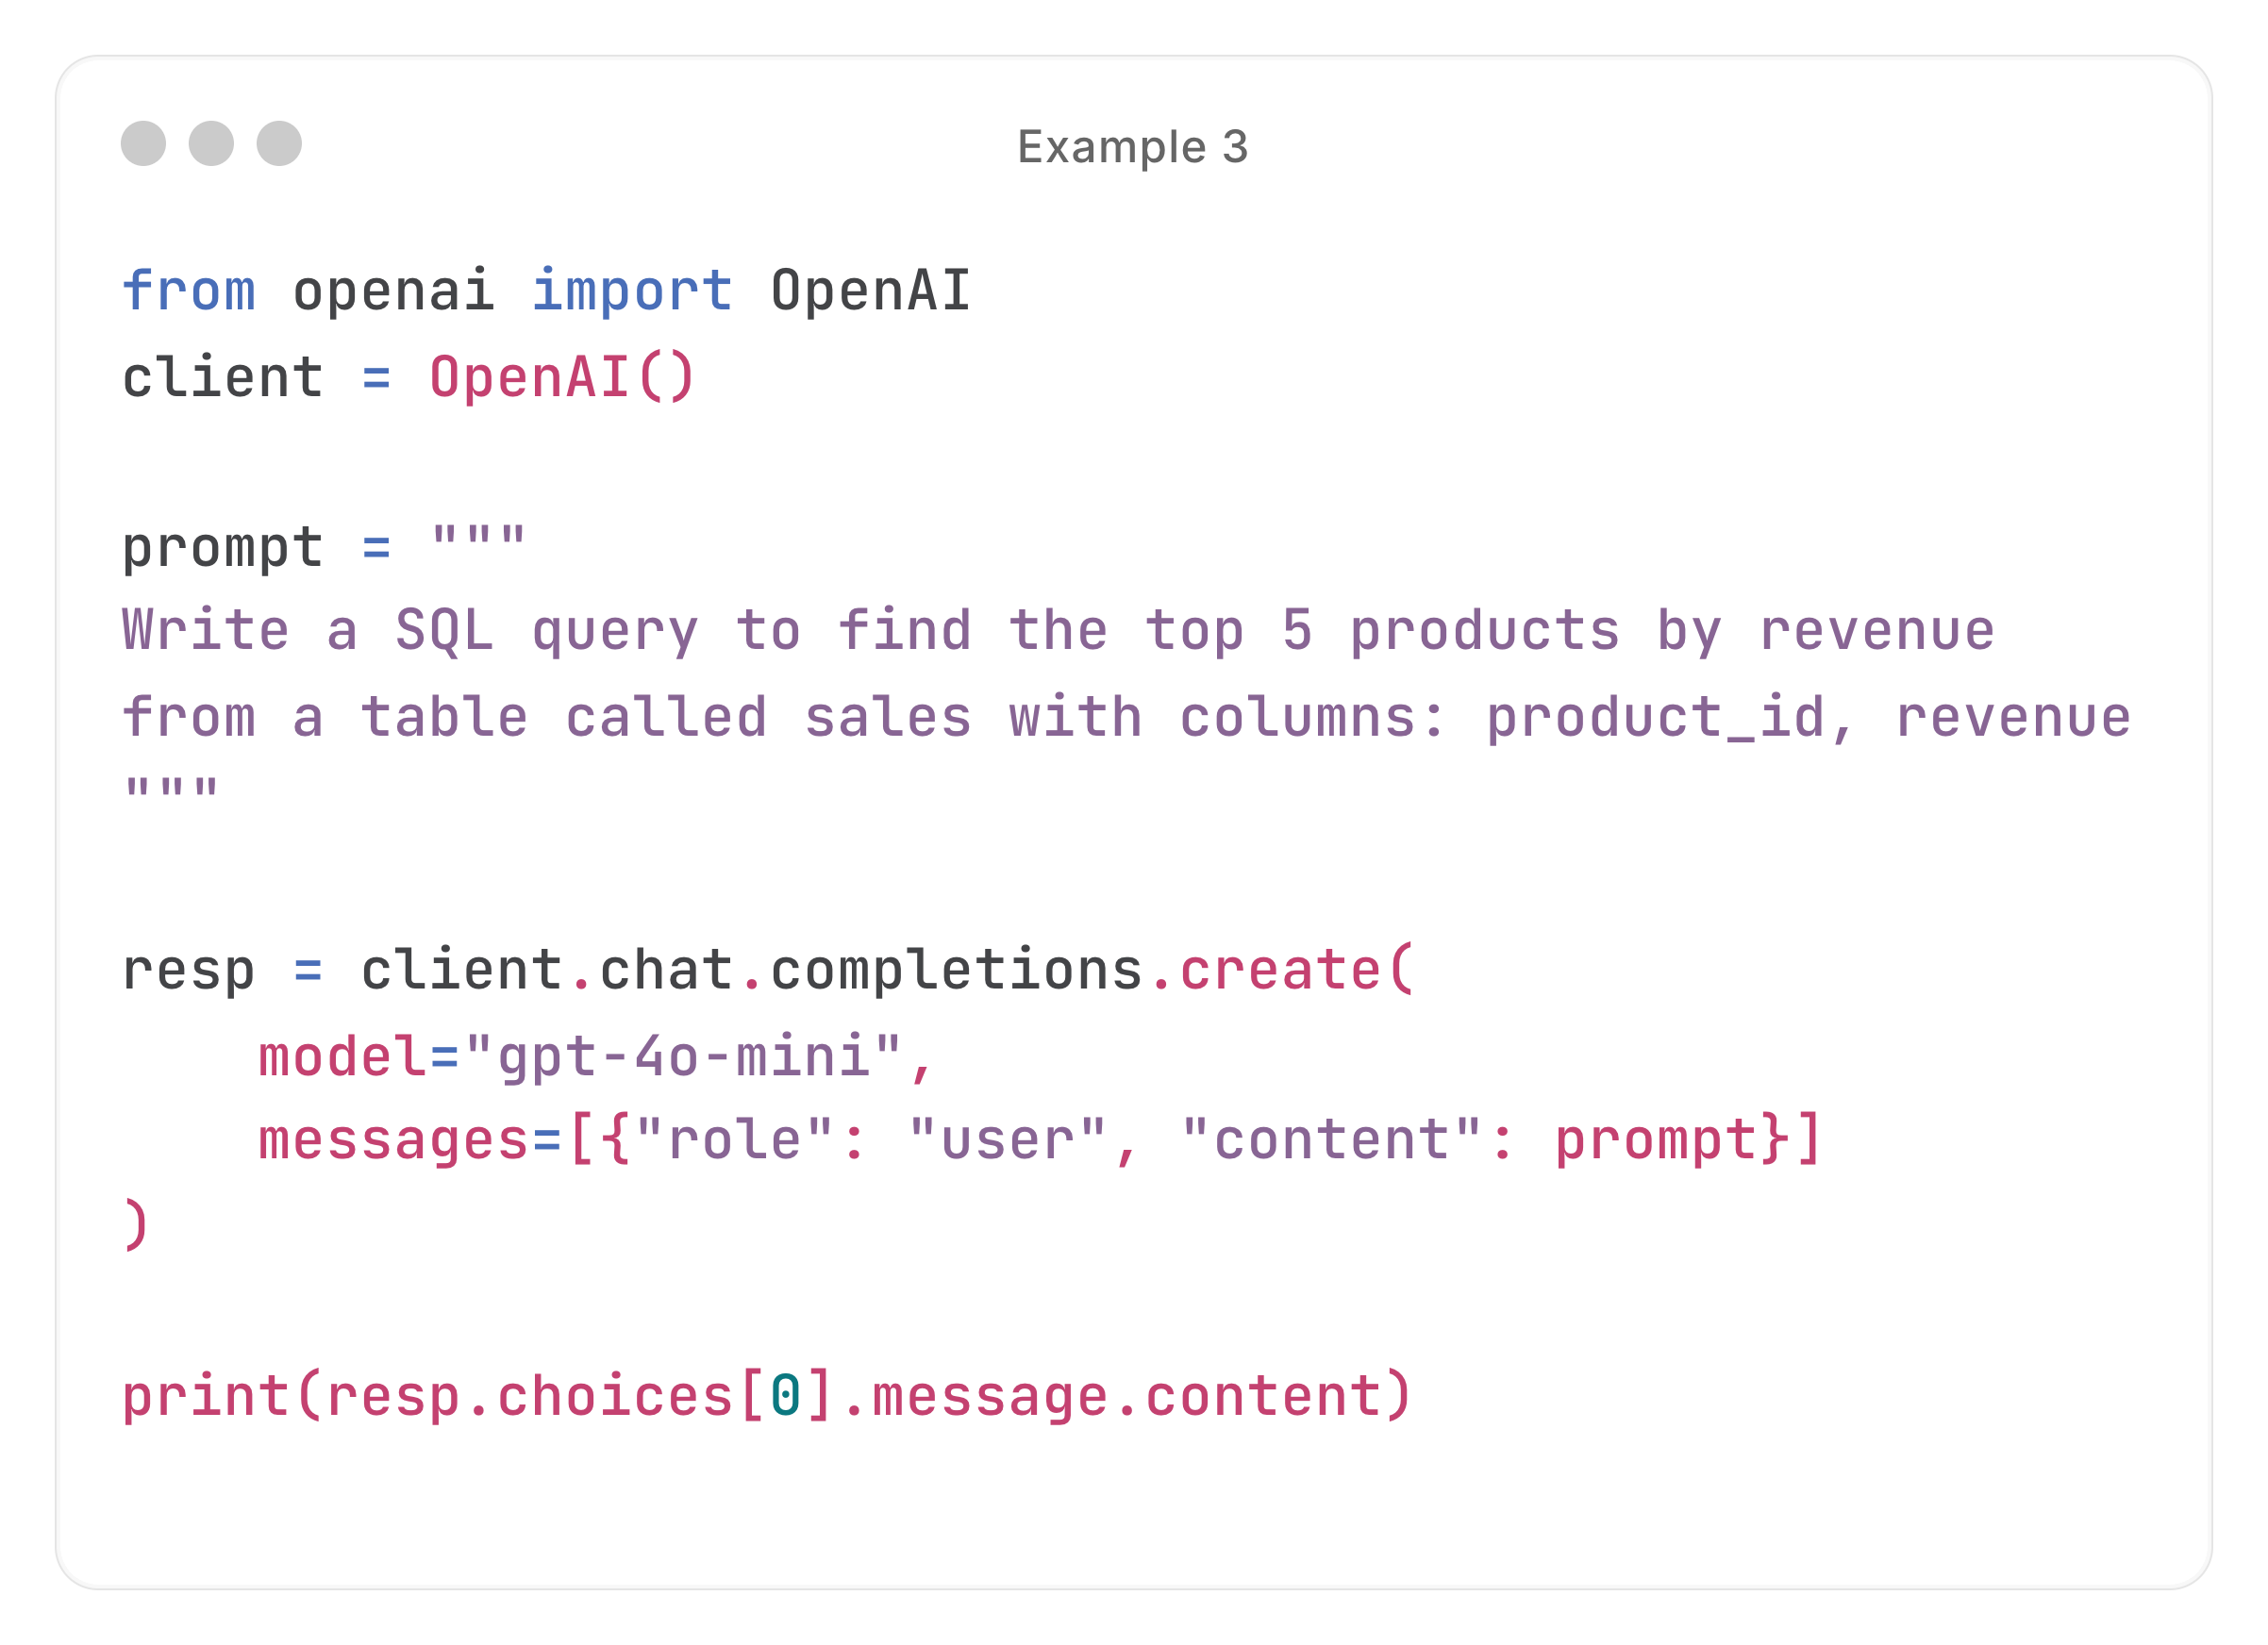
This is just the MVP; we hardcoded the table and schema in the prompt. But you can take it to the next level
Dynamically feed in table metadata (table names, column names, sample rows) so the model has context by connecting to the SQL database
Build an AI agent that not only writes SQL but also searches for the right table to query — we’ll talk more about AI agents in a future newsletter!
Test, get feedback, and iterate
The first version you build is rarely the final version.
Once you’ve got your MVP working, the next step is to test it in a real workflow. Run it alongside your normal process and ask:
Did it save me time?
Was the output accurate enough?
Is there an easier way to do the same thing? (Maybe without an LLM?)
From there, make small adjustments. Maybe you tweak the prompt, or add a post-processing step in Python, or expand it to cover more inputs… the world is your oyster!
And don’t do this in a vacuum. Make sure to share early versions with your teammates or stakeholders for feedback!
Follow my friends’ newsletter
Save 50+ hours/week with deep dives, trends, and tools hand-picked from 100+ sources.
Join 50,000+ engineers for 1 free email every Monday → https://www.hungryminds.dev/