
Building a Monte Carlo simulation in Python from scratch
Full Python code included!

A Monte Carlo simulation is a way to estimate probabilities by running the same process many times with randomness baked in. Instead of one closed-form answer, you get a distribution of outcomes.
It is common in forecasting, risk modeling, and any system with uncertainty where an analytic solution is hard. Here are a few common examples across industries:
Finance: value at risk, portfolio drawdowns, and stress testing under different market paths
Supply chain: inventory planning under uncertain demand and lead times
Energy: price simulations for hedging and generation planning
Healthcare: patient flow forecasts for staffing and bed capacity
Product and growth: conversion funnel uncertainty and experiment lift ranges
But since NFL playoffs are in full swing, I used Monte Carlo to estimate each NFL playoff team’s probability of reaching and winning the Super Bowl for the 2025 season, the 2026 playoffs. Figured we’ll do something fun with the Monte Carlo 😉
Full code is here: https://github.com/dawnxchoo/nfl_models_analysis/tree/main/playoffs_monte_carlo_simulation
Getting into our Monte Carlo simulation for the NFL playoffs
Think of each playoff game as a weighted coin flip, where the Elo (or strength rating) difference sets the probability of which tea will win.
Step 1: Initialize all teams at Elo 1500
If you don’t know what Elo is, it’s simply a strength rating. The higher the number, the stronger the team.
Every team starts at the same baseline of 1500 Elo at the beginning of the season. This makes the model easy to reason about and reduces bias from subjective priors.
def initialize_elo_ratings(df, initial_elo=1500):

    home_teams = df[’home_team’].unique()

    away_teams = df[’away_team’].unique()

    all_teams = set(list(home_teams) + list(away_teams))

    elo_ratings = {team: initial_elo for team in all_teams}

return elo_ratings
Step 2: Update Elo over the regular season baed on whether they won the game, and the strength of their opponent
we process every regular season game in date order and update both teams’ ratings after each game, based on whether they win or loe. If a favorite wins, the ratings barely move. But.. if an underdog wins, the team’s Elo rating increases by a large amount is larger.
We also add 55 Elo points to the home team in the win probability calculation to account for home field advantage. See code below.
def compute_win_probability(elo_home, elo_away, hfa):

    diff = (elo_home + hfa) - elo_away

    p_home = 1 / (1 + 10 ** (-diff / 400))

return p_home
## this goes into the function for updating elo
actual_home = 1 if home_score > away_score else 0
delta = k_factor * (actual_home - p_home_win)
new_elo_home = elo_home + delta
new_elo_away = elo_away - deltaStep 3: Freeze Elo at the end of the regular season / the start of the playoff season
Once the playoff bracket starts, Elo stays frozen. The goal is to simulate pre playoff expectations, not update teams as if the playoffs were part of the rating system. We could do this in a future iteration, I just chose to keep it simple.
Step 4: Simulate the winner of a single game
This is a key component of the Monte Carlo simulation. For each playoff game, we compute the home team win probability from Elo, draw a random number, and pick the winner based on that probability.
The winner of each game determines who moves onto the next round, which is explained in our next step.
def simulate_game(team_home, team_away, elo_dict, hfa, is_neutral=False):

    elo_home = elo_dict[team_home]

    elo_away = elo_dict[team_away]

    p_home_win = compute_win_probability(elo_home, elo_away, hfa, is_neutral)

    u = np.random.random()

    winner = team_home if u < p_home_win else team_away

return winner, p_home_win
Step 5: Simulate the playoff bracket with reseeding
The NFL bracket is not a fixed tree, so I hardcoded the seeds and handled reseeding after every round. For example, in the Divisional round, Seed 1 always hosts the lowest remaining seed.
def simulate_divisional(conference, wild_card_winners, seeds, elo_dict, hfa):

    team_to_seed = {team: seed for seed, team in seeds.items()}

    remaining_seeds = sorted([team_to_seed[team] for team in wild_card_winners])

    seed_1_team = seeds[1]

    lowest_seed = max(remaining_seeds)

    lowest_team = seeds[lowest_seed]

    winner_1, _ = simulate_game(seed_1_team, lowest_team, elo_dict, hfa)

    other_seeds = [s for s in remaining_seeds if s != 1 and s != lowest_seed]

    higher_seed = min(other_seeds)

    lower_seed = max(other_seeds)

    winner_2, _ = simulate_game(seeds[higher_seed], seeds[lower_seed], elo_dict, hfa)

return [winner_1, winner_2]
We then have a similar function for the Conference Championships and the Superbowl.
Step 6: Run 10,000 simulations and aggregate probabilities
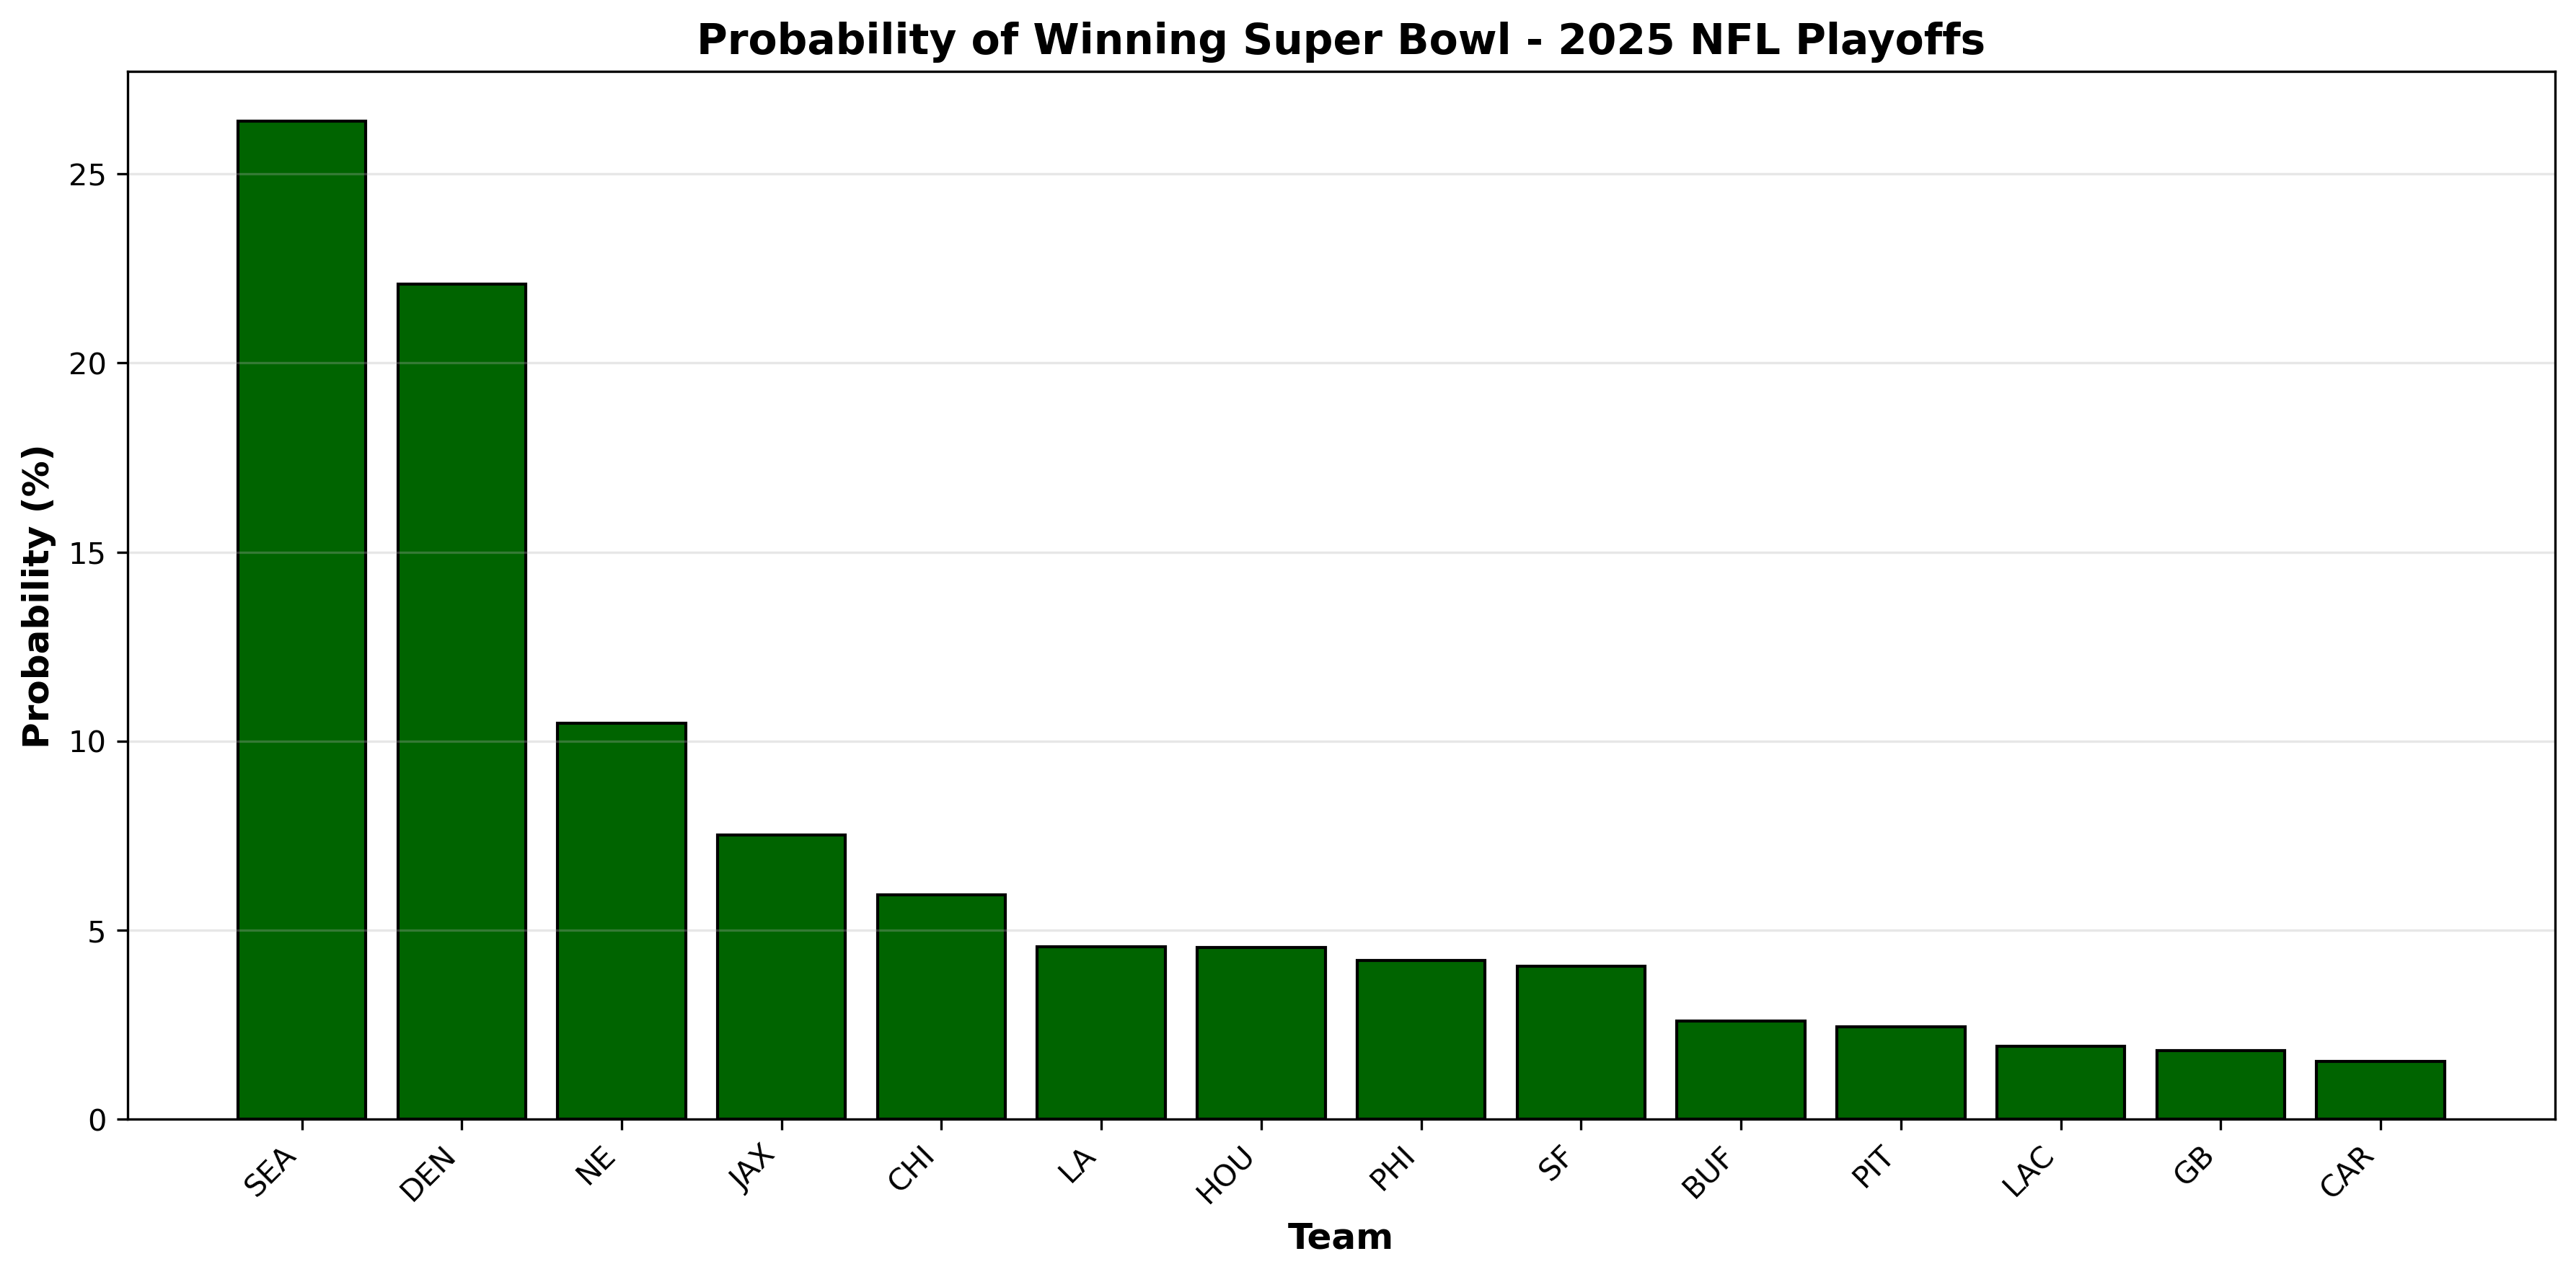
Now we have enough code to simulate a single full playoff bracket. Next, we repeat the full bracket 10,000 times, and count the number of simulations in which each team wins the Superbowl.
Finally we can plot the probabilities to visualize the probability that each team wins the Superbowl, like our chart below.
It looks like we are expecting the Seattle Seahawks to win it all with a 48% probability!
[Bonus] Step 7: Build a lightweight app to visualize the Monte Carlo simulation
I quickly built an app with Replit, as demonstrated in this video.
The prompt that I used is also in my GitHub repo: https://github.com/dawnxchoo/nfl_models_analysis/tree/main/playoffs_monte_carlo_simulation
ICYMI (in case you missed it!)
Build a data cleaning & reporting workflow in 2 minutes (without code), using KNIME
Top things I saw at CES Unveiled 2026
Logistic Regression model in Python walkthrough
If you’re in Tokyo and want to attend the DDX Tokyo Conference (Feb 4th), details are here.
How to use Claude Code for Data Analytics